
The result, told by the people in it.

Club retainer
Digital fills the ground.Operations fills the till.
One retainer runs both, as your club's external Chief Revenue and Digital Officer.
23 days. Operations.342 days. Digital.
(01)The caseTwo numbers, multiplied
Matchday revenueis two numbers multiplied.
How many come through the gate. What each of them spends inside.
Digital moves the first. Operations moves the second.
Move both and each one lifts the other.
A second round at half time only happens if the queue is still moving. That is an operations problem sitting inside a digital crowd.
Crowd1,200Through the gate
Spend per head£12.00Once they are inside
Matchday revenue£14,400
(02)SaturdayThe operations side
23 afternoons.The whole season's trading.
Lengthen the trading window. Get people through the gate earlier and keep them later, especially in the hour before kick-off.
- 13:00
The ground starts to fill. 47% of in-ground revenue comes before kick-off. Every outlet open, so the early money has somewhere to land.
- 15:00
Kick-off. The concourse empties.
- 15:45
Half time. Fifteen minutes, one crush, 7% of the day.
- 16:50
Full time. 18% of the day sits in the half hour after the whistle.
Share of in-ground revenue by phase of the day. Pre-match 47%, first half 13%, half time 7%, second half 12%, post-match 18%.
(03)The weekThe digital side
342 days.One reason to come back.
The manager, the captain and the person on the turnstile.
A reason to be there tomorrow.
They come. And they bring someone.
Attendance that comes from habit survives a bad season.
A supporter who knows the club buys a ticket because it is Saturday.
(04)RetailBeyond the shirt
The shirt is the start.The rest of the wardrobeis the opportunity.
Take a typical supporter. They might buy the shirt once a season. The rest of what they would wear is where most club ranges run thin.
People buy those pieces because they are proud of the club. Digital builds the pride. Operations builds the range, and a shop that opens between matchdays.
At Farnham Town, a sticker album of a Step 2 squad sells because the children collecting it know who the players are.
 Shirt
 Jacket
 Hat
Retail sells on all 365.
(05)How it runsOne season at a time
Audit.The order they pay.The season.
We go through your commercial revenue matchday by matchday and your digital estate end to end. Ticketing, food and beverage, retail, hospitality, sponsorship, the website and every channel the club posts on.
Then we hand you the moves worth making, sequenced so the ones that pay first come first. Each one carries what it is worth across a season, so the board can see the case.
From there we run them with you across the season, with a CRM and dashboard built around revenue per head so you can manage the number week to week.

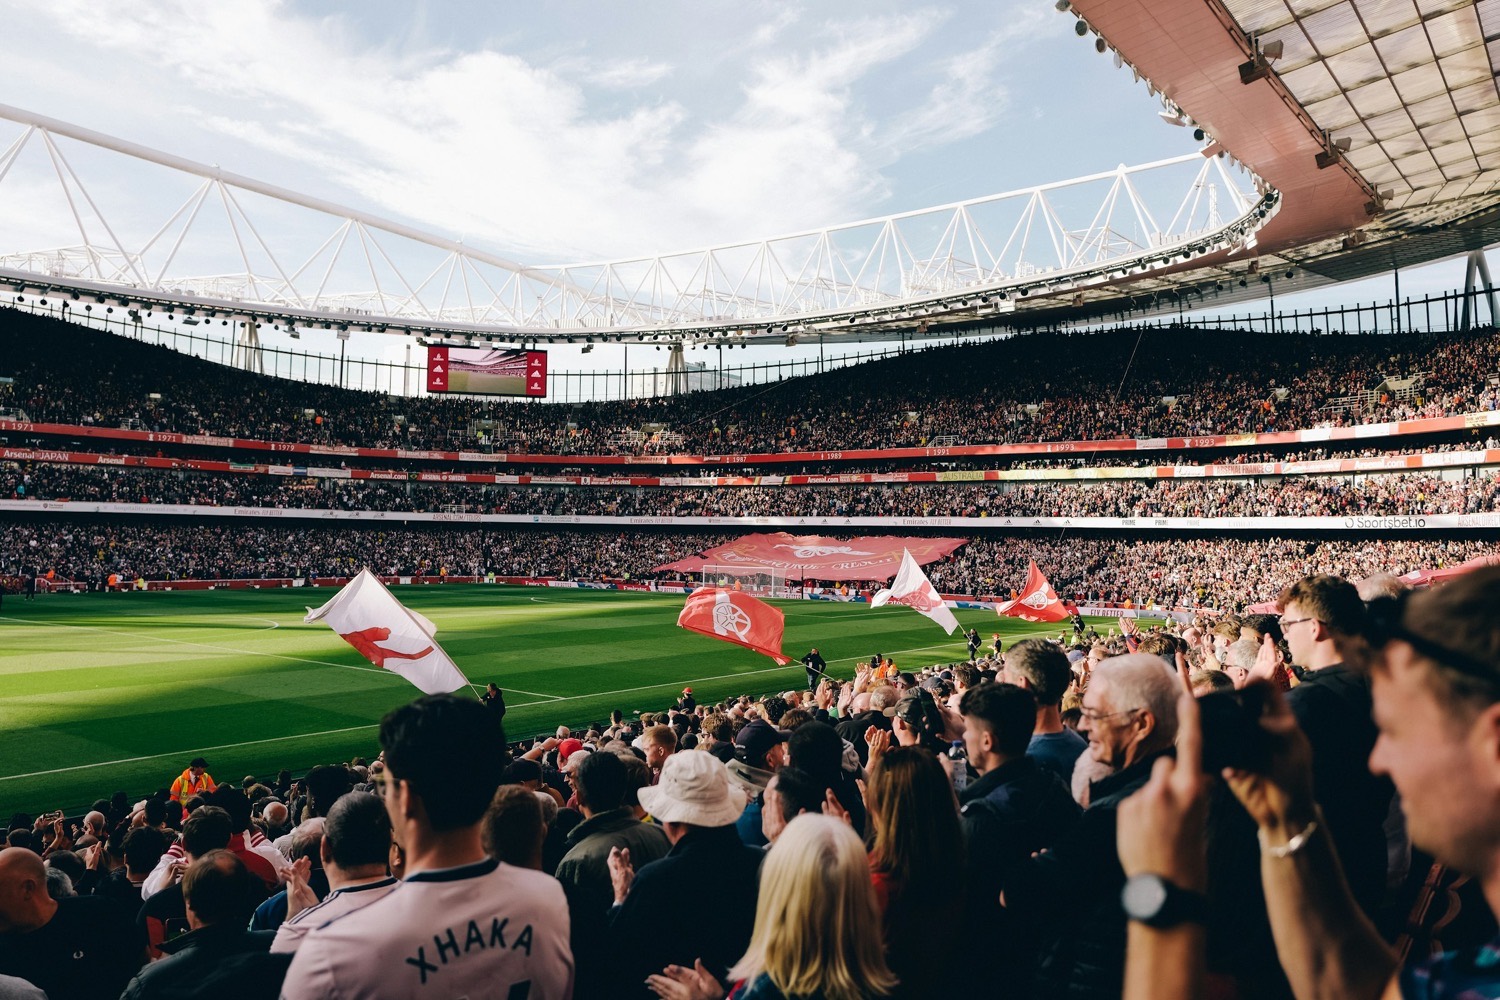
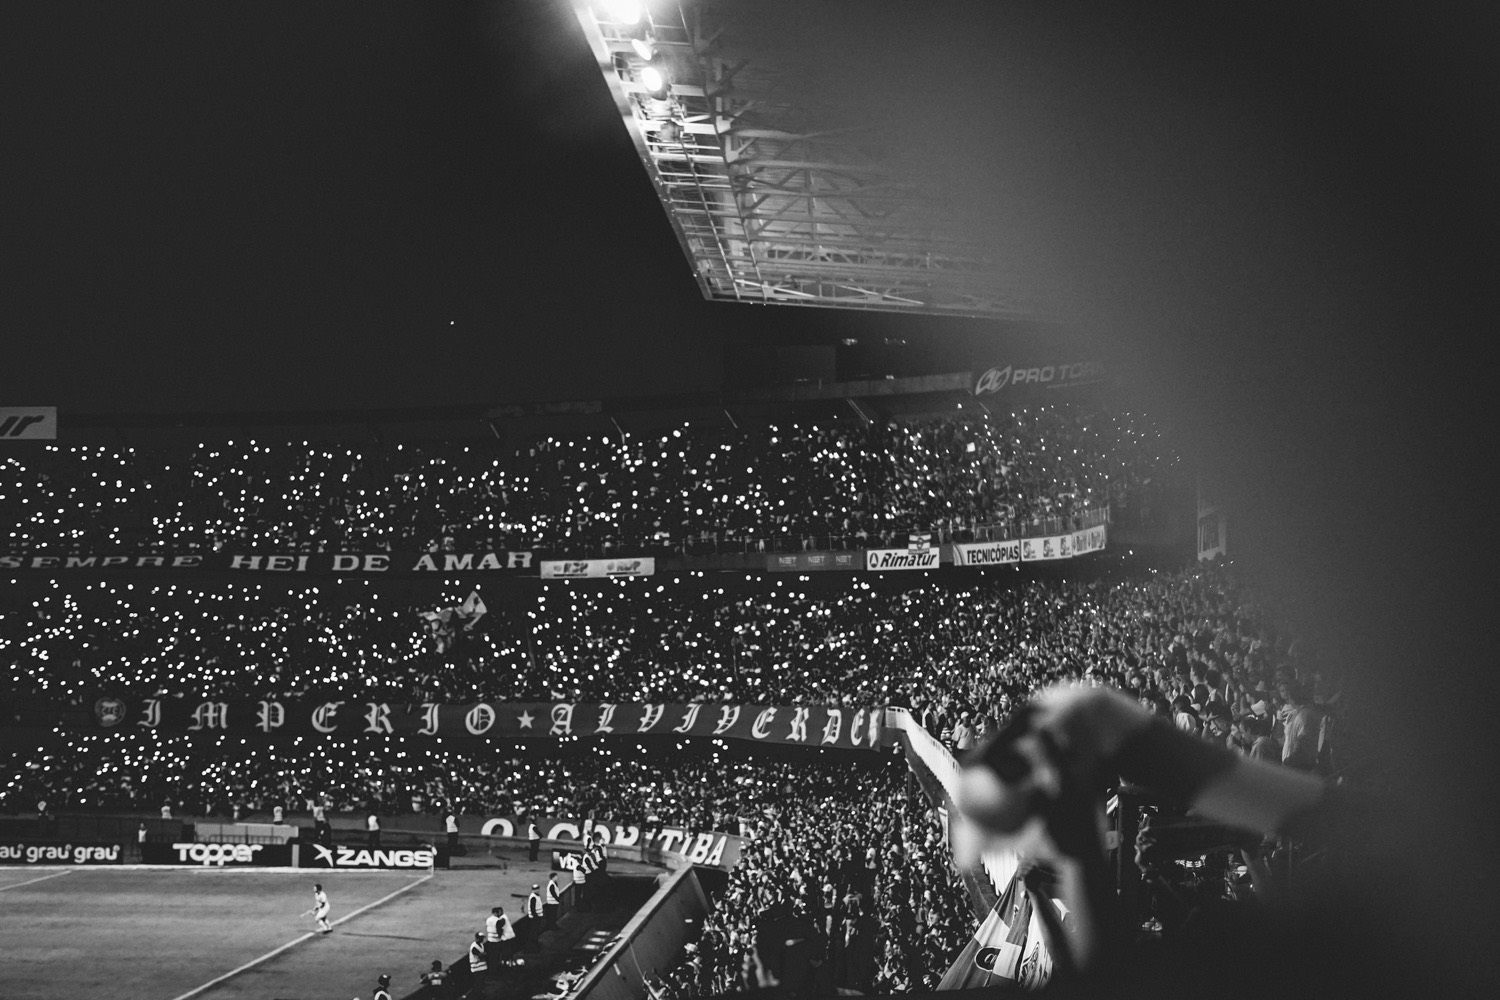
Start from either side. A ground with room in it: digital first. A full ground whose takings still have room to grow: matchday first. By the end of the season both are moving.
(06)The proofFarnham Town
Step 5 to Step 2.Three promotions in a row.
Our club, and where this work started. Our first season was 2021/22. We have made these decisions with our own money before making them with yours.
2025/26, up from £7.45 in 2021/22.
2026/27, up from 85 in 2019/20.
2025/26 season.
Since 2022.
August 2026.
2023/24 to 2025/26.
League One is the division-wide average: total matchday revenue divided by total attendance. Where these figures come from.
Average attendance, 2019/20 to 2026/27
Our first season was 2021/22. The chart starts two seasons earlier to show the club before, including the seasons hit by COVID.
UK clubs by views
- 39
 AFC BournemouthPremier League
- 40
 Farnham TownNational League South
- 41
 Luton TownChampionship
Ranking of UK club accounts by views. Off Pitch data, correct as of August 2026.
Three promotions
- 2023/24Combined Counties Football League Premier Division South
- 2024/25Isthmian League South Central Division
- 2025/26Southern Football League Premier Division South, via the play-offs
Ends at National League South, 2026/27.
Fifteen years building audiences together, from our own football accounts to The Goat Agency. Now Farnham Town.
(07)PricingThree ways in
Start small,or retain the whole season.
Ninety minutes
£250, with a written summary for your board.
Your own view
A matchday revenue or recruitment dashboard. Club-owned, privately hosted, and yours once it is built. Typically from around £2,500. A simple one costs less.
Matchday revenueThe season
Priced by division and scope. On the largest opportunities the fee is tied to the revenue we help create.
Send your numbers. The conversation about scope costs nothing.
(08)Tell us about your clubWe reply within two working days
Start withthe number.
Bring your attendance and what a matchday takes today. That is enough to tell you where the next pound comes from.