
Up from 85 a game in 2019/20, with sellouts above 2,300.
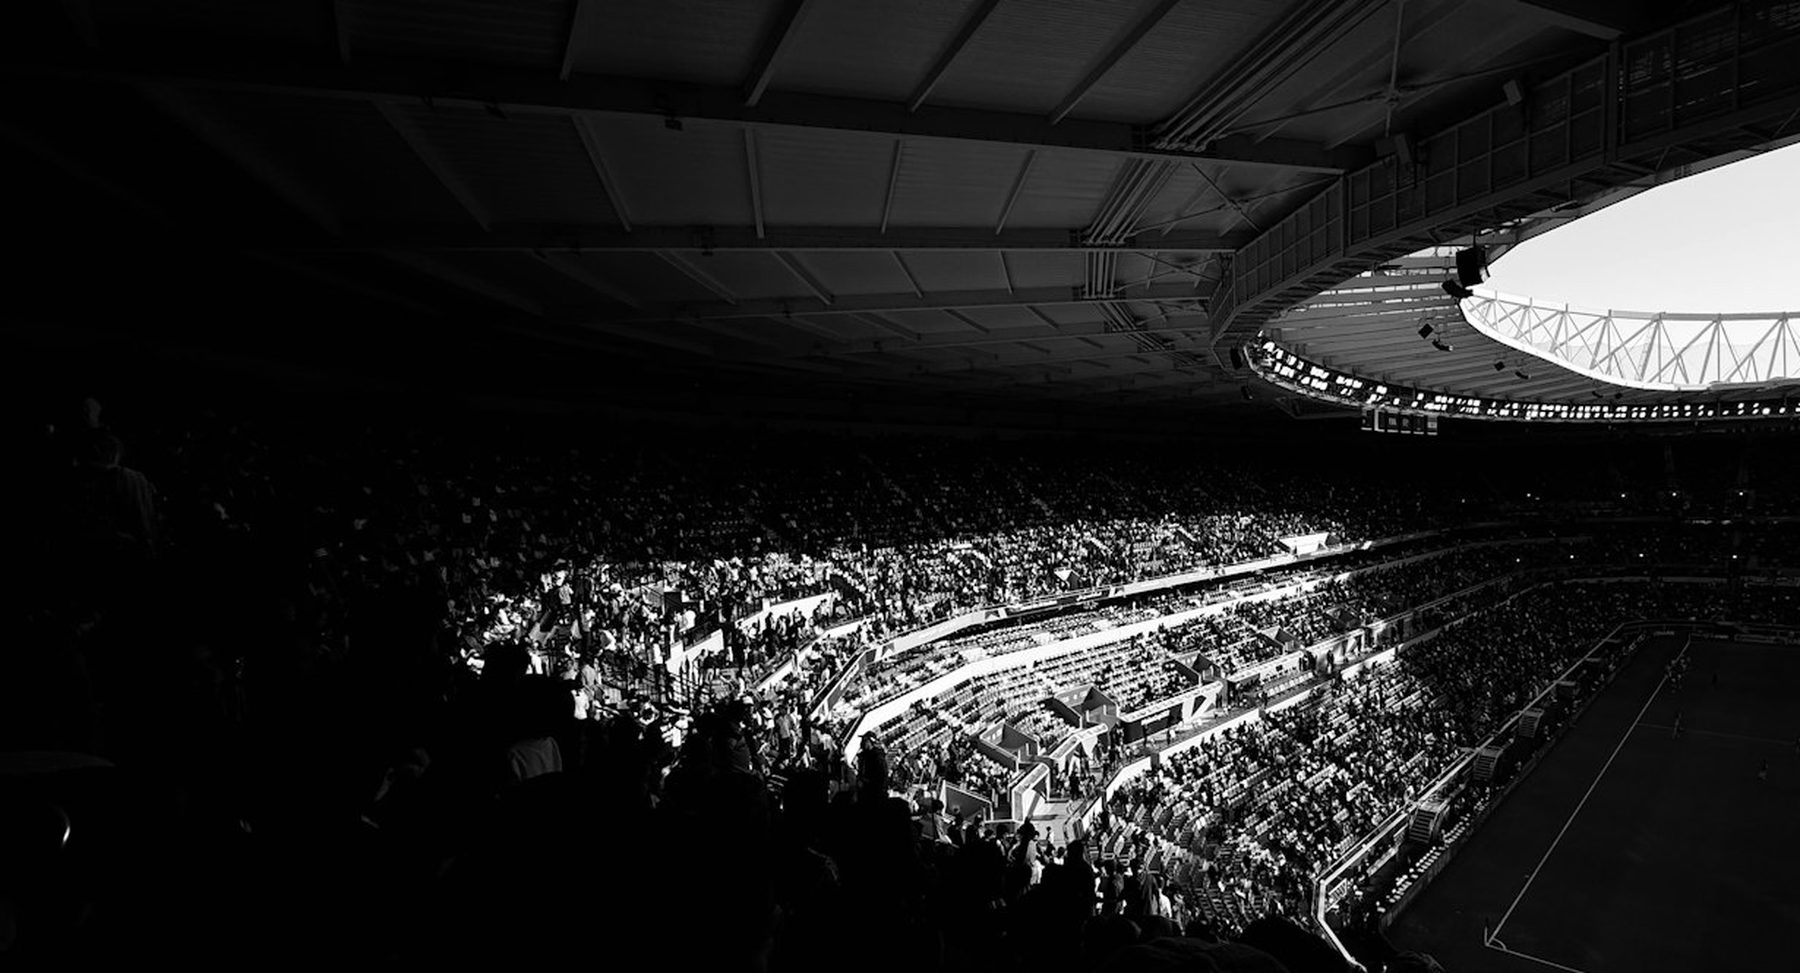
A club isopen 23 daysa year. Therelationshipruns for 365.
Revenue per head, attendance and the audience behind both. Digital is one of two retainers that move all three, and it works on the 342 days a club is not open. A supporter who follows the club through the week comes more often and spends more when they do.
(01)The caseHabit beats a good run
A supporter whoknows the clubspends more thanone who knowsthe score.
A first visit comes from a cup run, a promotion push or a friend with a spare ticket. The club then has until the next home game to turn that person into a supporter, and for those weeks it exists as a phone screen rather than a place.
For most clubs that phone screen carries team news, a results graphic and a kick-off time. Someone reading that learns the fixture list, and a person who knows the fixture list buys a ticket when the opponent appeals.
A supporter who knows the manager, the captain and the person running the turnstile buys a ticket because it is Saturday. The same person buys the shirt in July, brings a friend in March and takes the away trip in February.
Attendance that comes from a good run drains away when the run ends.
Attendance that comes from habit survives a bad season.
(02)ExperienceWhere this comes from
Fifteen yearsbuildingaudiences forbrands andrights holders.
Off Pitch comes out of fifteen years of audience work for global brands and sports rights holders, across leagues, governing bodies and clubs at the top of the game.
That work was judged on what an audience did next. A click, a download, a sale, a ticket.
A football club is the same problem with a warmer audience and a shorter list of things to sell. Supporters already want a reason to care, so the work is giving them one often enough to become a habit.
Off Pitch applies the same standard to a football club. Every stage below is measured on the stage after it.
(03)What we doThree stages, run in order
Buildingthe audience.
Three stages, run in order, each one measured on the stage after it rather than on reach.

01Found
Everywhere a person looks for the club and finds it. Search results, social accounts, maps, fixture and ticket pages, all leading to a site where someone who has just heard of the club can buy something within two clicks.
Search and discoverability, the website itself, fixture and ticket pages, maps and listings.
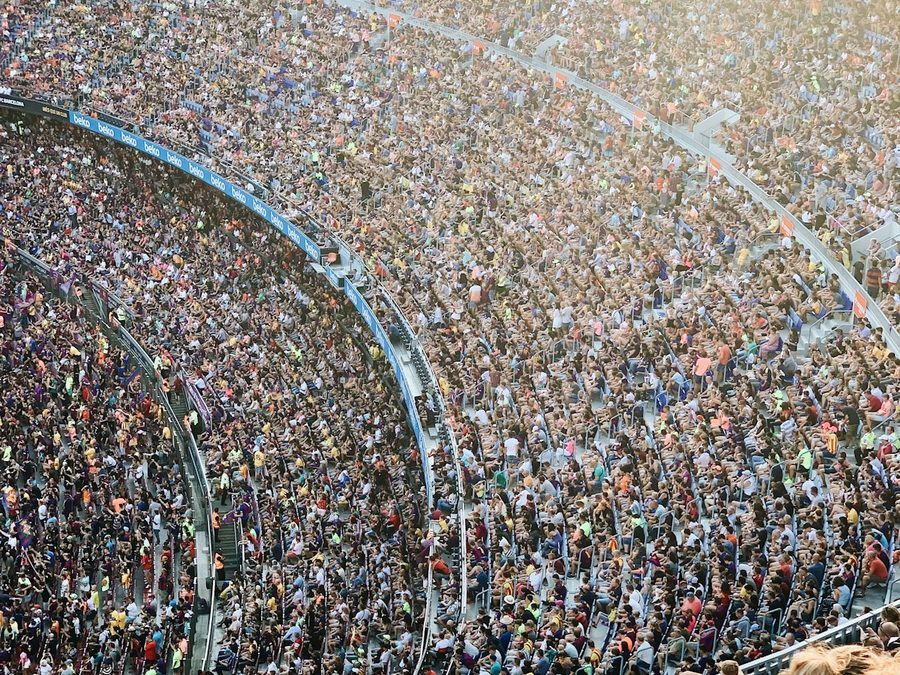
02Watched
Supporters follow finance, infrastructure, sponsorship and recruitment now, and the national press covers all four. A club telling those stories itself owns the version that gets repeated, and the rebuild of the club supplies the material.
Content production, video, and the channels it goes out on.
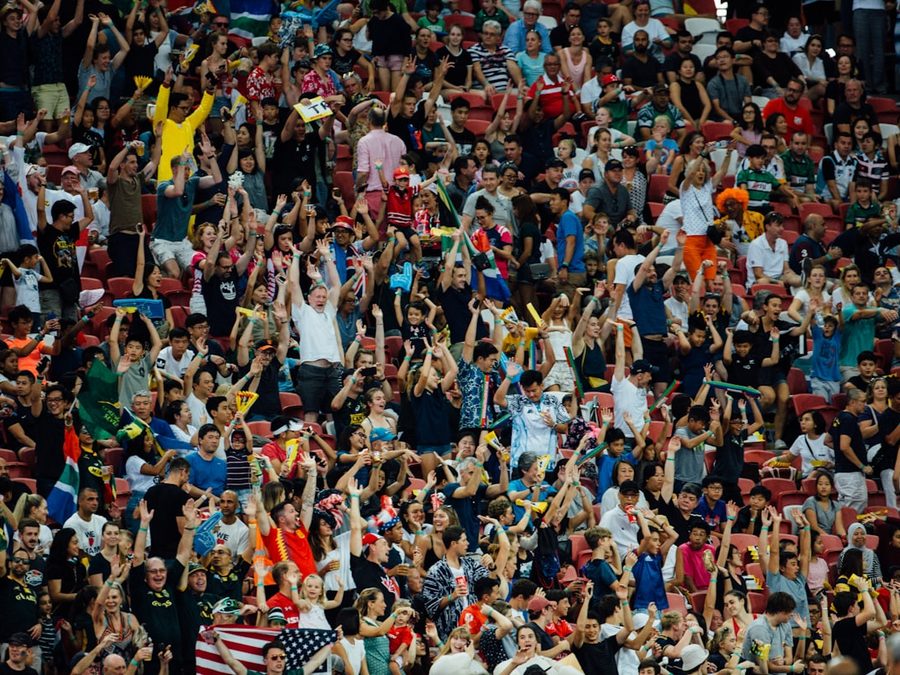
03Attached
Replies, comments, and the players and staff as people rather than a squad list. A supporter who gets an answer from the club comes back to it, and the club produces this at a volume it can sustain without outside help.
Community management, email and CRM, and the paid spend behind both.
What it returns
Through the gate
Attendance that holds through a poor run, and first visits converted into season tickets. Paid spend measured against tickets sold rather than impressions.
Bought across the year
Demand for shirts, drops and memberships in weeks with no fixture, when a club is competing with everything else a supporter could spend on. A sticker album of a Step 2 squad sells because the children collecting it know who the players are.
Worth more to sponsors
Across the EFL a supporter returns about £15.90 a season in commercial income. Wrexham returns £74.87 from League One on a gate of 13,938, against a divisional median of £14.91.
EFL median, per supporter£15.90
What a supporter returns in commercial income across a season, on the Football League median.
Wrexham, League One£74.87
On a gate of 13,938, against a divisional median of £14.91. The audience paying for it watches from home.
Commercial income per attendee, 2024/25. Sponsorship, partnerships and licensing, divided by total home attendance.
(04)The proofFarnham Town
Farnham Townstarted with nomedia team anda gate of 85.
That was 2019/20. By 2025/26 the average gate had grown to 1,400+, matchday revenue per head from £7.45 to £17.60, and sponsorship revenue by a factor of ten. Both retainers moved that per head figure. The audience decided how many people arrived and how well they knew the club before they did.
The club now sits among the 40 most-watched in English football, between AFC Bournemouth and Luton Town, with partners including the Sidemen, Callux and Pitchside.
The media team pays for itself. Platform income across the club’s channels covers the salaries behind them and contributes beyond that.
Matchday revenue per head, up from £7.45.
Sponsorship revenue across the period.
Among the 40 most-watched clubs in English football.
(05) Talk to us

Talk to usabout yourclub.
Bring your attendance, your matchday take and your channels, and the conversation starts from your numbers rather than from a pitch.
Retained partnership
Off Pitch works as an external Chief Revenue and Digital Officer across all three levers, retained across a season and measured on revenue rather than output. Send your numbers and the conversation about scope costs nothing.
Priced against the scope of workEnquire about a partnershipConsultancy call
A working session on your club, booked for as long as it needs, with a written summary afterwards. Suited to a club with the people to do the work and no outside view on where to point them.
£250 for ninety minutes